
Cary COVID Report – July 29
Cary, NC – While Wake County, NC new coronavirus cases bounced back up in the last week, the larger trend for North Carolina and much of the South is flattening.
Our Data Sources
We get our data from these trusted sources. They all have different ways of portraying the data to help you get a complete picture of the COVID pandemic of 2020.
- Wake County COVID-19 Dashboard
- North Carolina Department of Health & Human Services
- Johns Hopkins Coronavirus Resource Center
Other sources noted as appropriate.
Wake County Infection Rate
Last week, we reported that new coronavirus cases declined in Wake County, NC on a week-by-week basis for the first time in 8 weeks. This week, they bounced back up, setting a new weekly record.
Data from Wake County. Visualization by CaryCitizen.
Mask Usage High in the Triangle
According to a new mask map published by The New York Times, mask usage in Wake County is high at about 79%.
By comparison, mask usage in nearby Danville, VA is estimated to be approximately 25%.
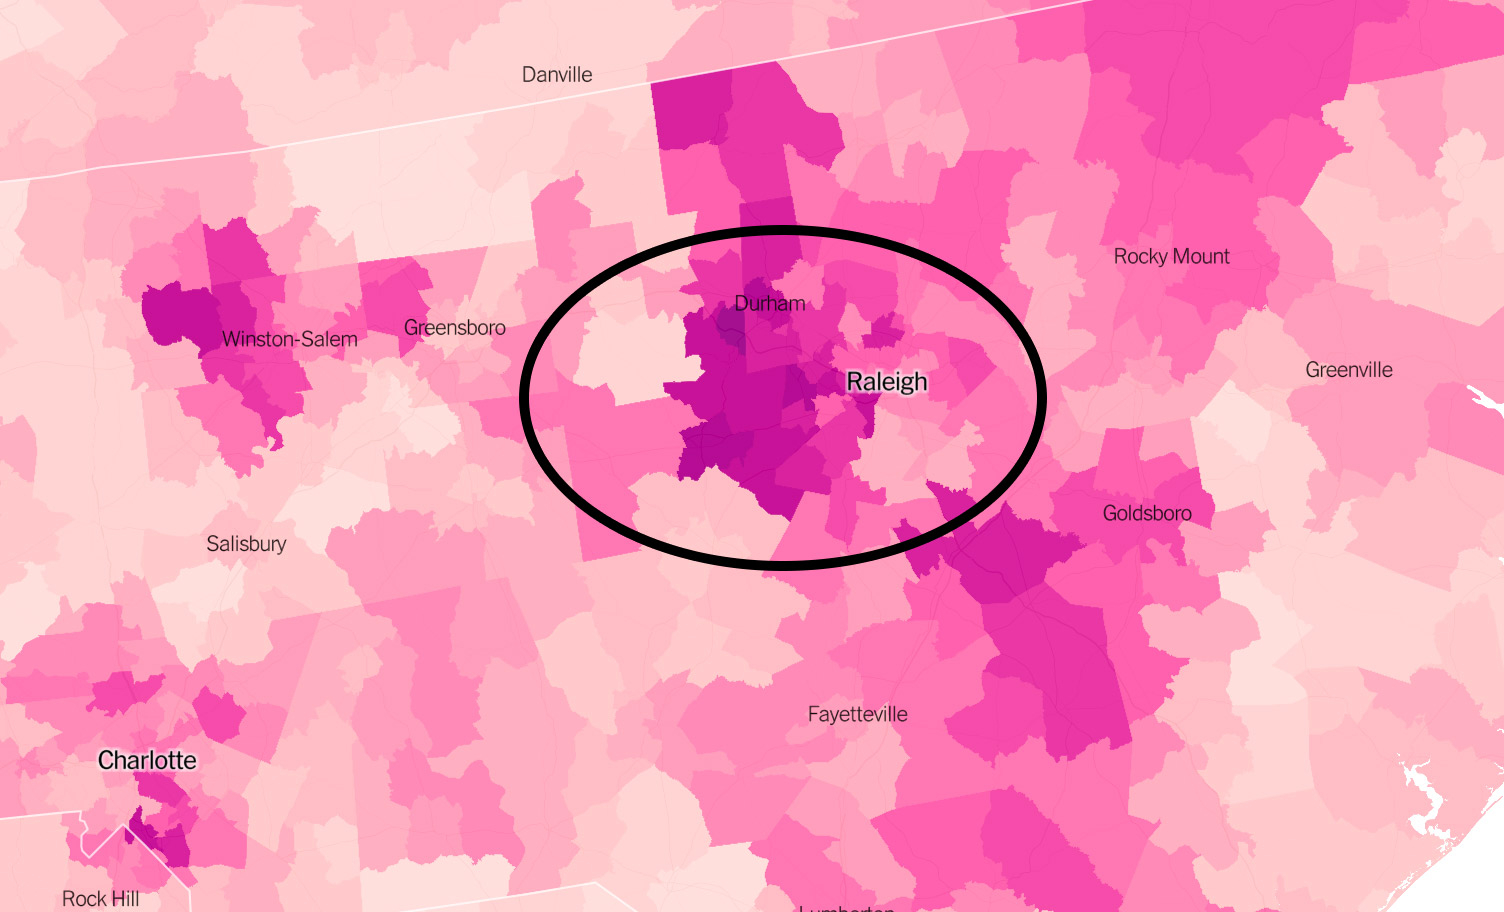
source: The New York Times
Around the US: Infection Rate Falls in the South
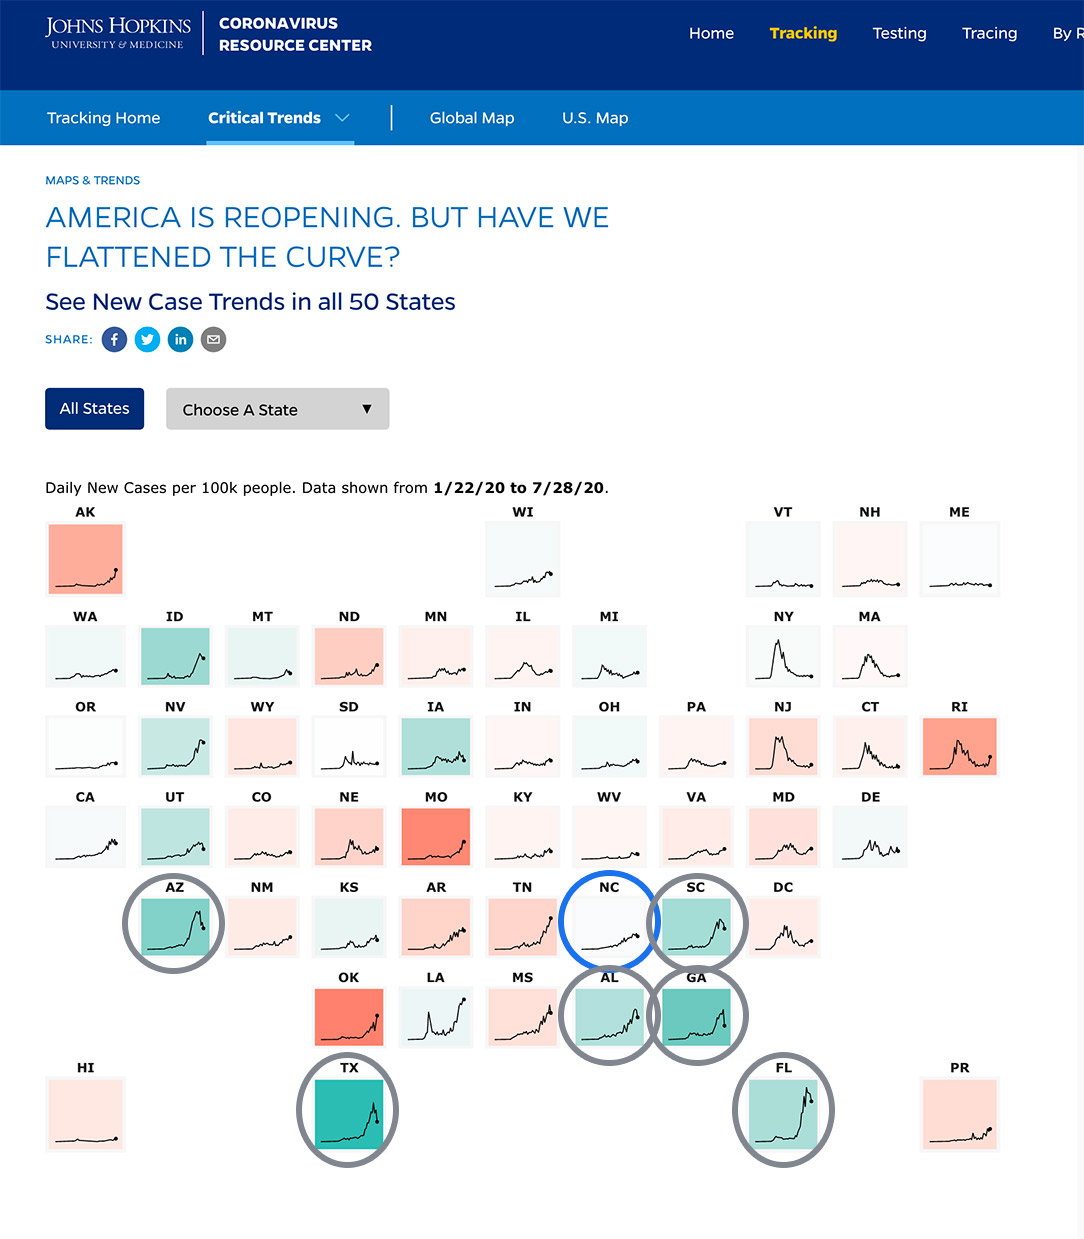
No wonder we all have whiplash. For the last month, the South has been bright red on the map of states with rising rates of COVID cases. This week, most of the states in the South, including South Carolina, Georgia, Florida and Alabama have changed to green, indicating that the infection rate is falling.
Across the U.S., the coronavirus focus shifted to the Midwest including Oklahoma and Missouri.
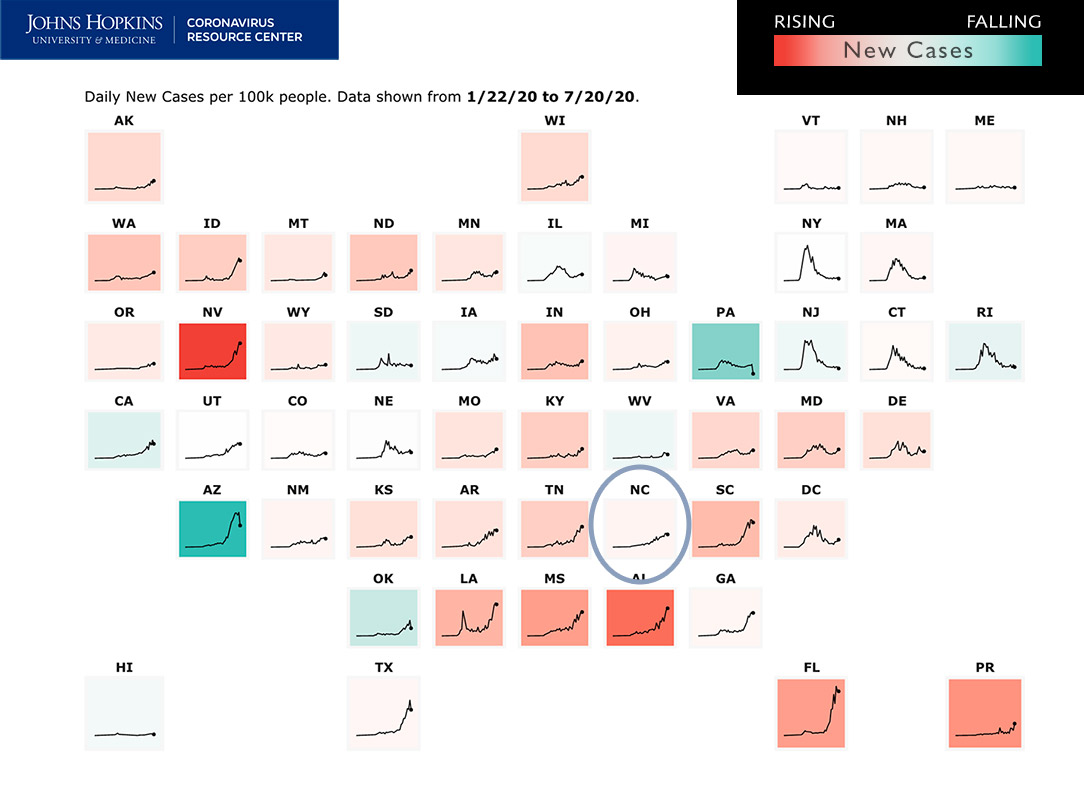
In the last week, North Carolina went from pale red to pale green, indicating a slight downward trend.
This Week’s States Map
source: Johns Hopkins
Last Week’s States Map:
U.S Starts to Bend the Curve?
For the last 10 days, new infections in the United States have shown a flattening of the coronavirus curve., according to data from the Center for Disease Control.
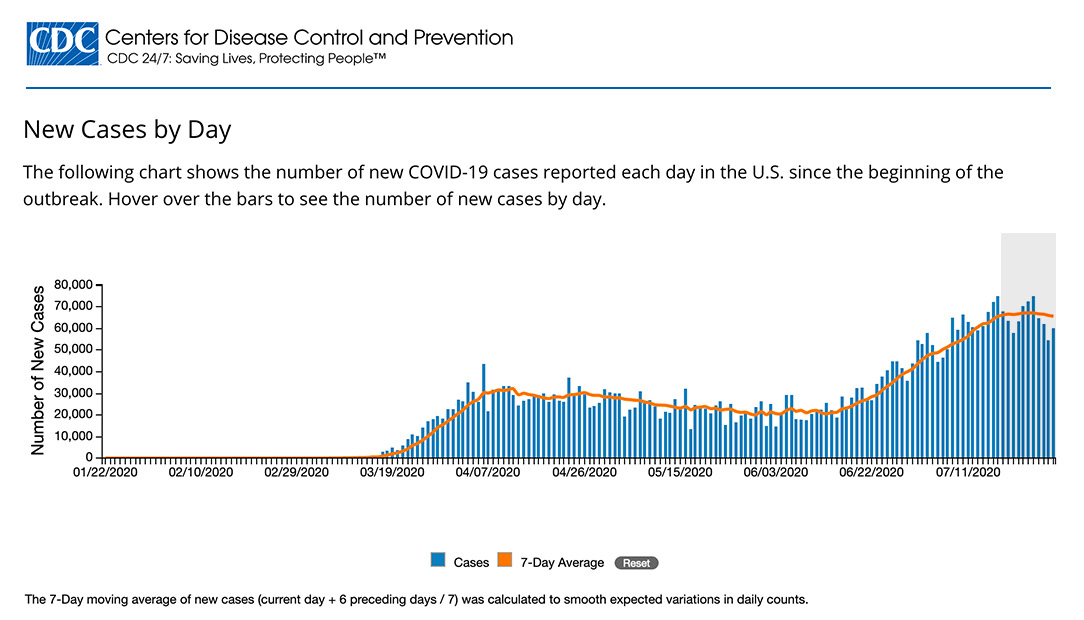
source: Center for Disease Control
Story from staff reports. See more COVID-19 coverage on CaryCitizen.
Please support the CaryCitizen GoFundMe campaign.


Thank you. Would you add hospitalization and ICU capacities and rates so they can be correlated against infection rate?
David – Wake County doesn’t provide hospitalization date (why not?). Statewide, hospitalizations have been rising gradually over the last few weeks:
https://covid19.ncdhhs.gov/dashboard/hospitalizations