Cary COVID Weekly Report – June 17
Cary, NC – Here’s your weekly COVID-19 Report. If you want to explore the data for yourself, visit Wake County COVID 19 or NC Dept of Health & Human Services.
Wake County: Infection Rate Continues to Rise
New cases of COVID-19 Coronavirus in Wake County continued to rise from 533 to 793.
Cases By Age
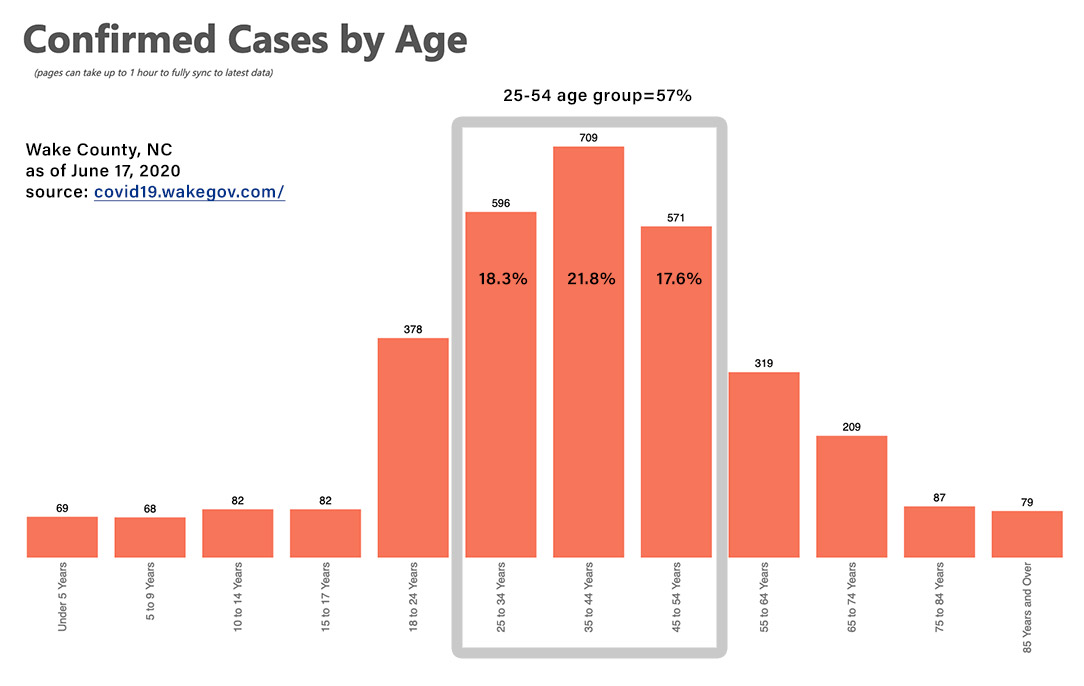
Cumulative cases by age group in Wake County NC.
Note: we’ve heard anecdotally that “all the cases are in the nursing homes.” Not true. The majority of cases in Wake County have been in the 25-54 age group. Source: covid19.wakegov.com.

Another Data Source for Cary Citizens
Since the beginning of the pandemic, Johns Hopkins has taken the lead in collecting data and presenting it to the public and professionals.
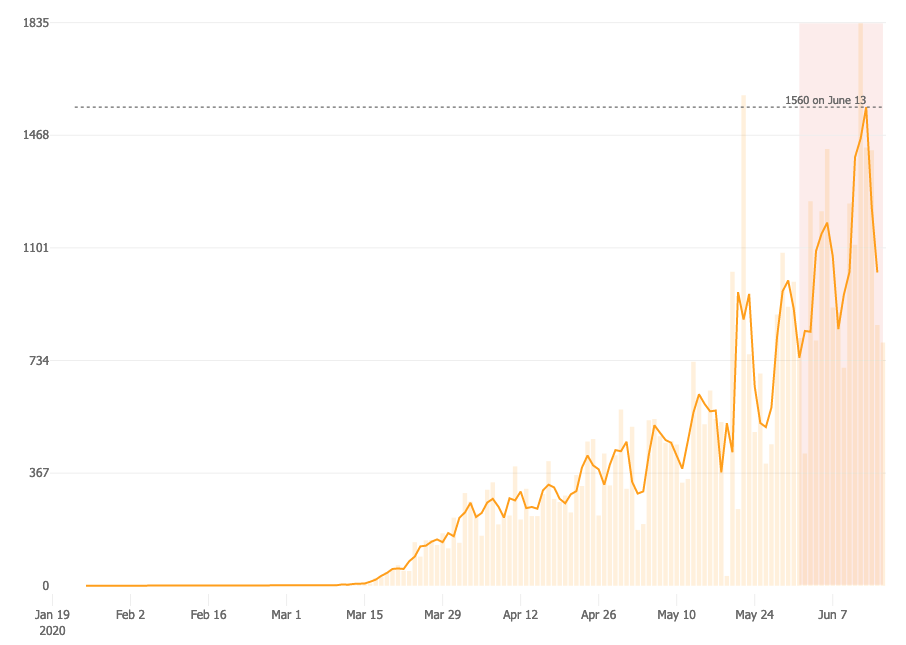
The graph below shows new cases of COVID-19 infections in North Carolina. Source: coronavirus.jhu.edu/data/new-cases-50-states/north-carolina

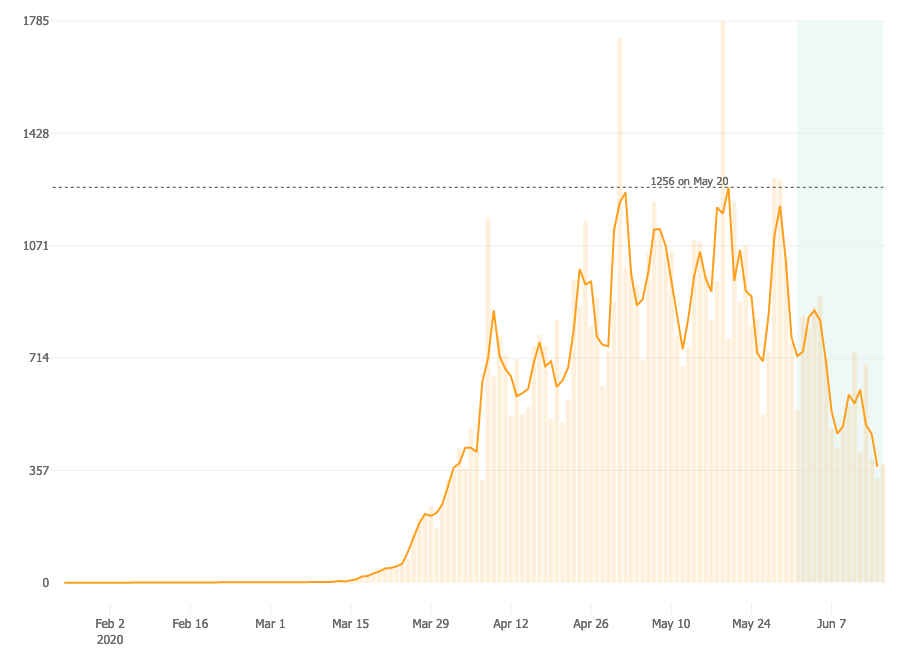
As a comparison, the second graph shows Maryland, a state with a falling infection rate.

Explore more data from Johns Hopkins at coronavirus.jhu.edu.
Story from staff reports. Data from Wake County, North Carolina Department of Health and Johns Hopkins.


What is the age breakdown for NC’s COVID 19 hospitalizations? Thanks!
Hi Norma – Neither Wake County nor NC-DHHS provide a data breakdown of hospitalization by age. However, the stats for deaths by age group are appalling. 60% of the cases are in the 25-54 age group, but 80% of the deaths in the the 60+ demographic. See the links in the story to explore the data for yourself.
I see your headline and have been running the numbers. There’s an important piece of Wake County data missing – not just from your article but from the published data – how many people have been tested and how many hospitalizations we have. I’m wondering if you know this – it would make for a more complete story. People are hysterical about the increased number of infections yet in NC, it’s been steady at about 7% of those tested (which means it’s actually lower given not everyone has been tested). I assume it might be the same for Wake? The infections have to go up – we never thought we could eradicate it, only flatten the infection rate and if we’re holding steady at 7%, that’s flat, right? The folks in the 25-54 age range would, intuitively, be the ones out and about and getting infected but how many are hospitalized? I see NC has 846 hospitalized but that we have 23,289 beds implying capacity and I know that we’ve gotten better at treating it and that many locations have emergency capacity plans that utilize off-line facilities and those outside our area. Similarly, I used to be able to find NC/County deaths by age group and facility but I’m not finding that anywhere anymore. Why is that? I don’t think we’re getting the complete picture. Just a portion leads to untruths. I know it’s risky to wade in those waters these days but this hysteria, the suicide rate, depression, economic decline, unemployment, the deficit, community division – will only get worse and it’s already terrible. Anything you can do to get the complete picture out there?
Hi Michelle – It sounds like you’ve dug into the stats for yourself. The big question: Is it safe, is the danger over? We leave to our readers to draw their own conclusions. But for me, as long as the infection rate is rising in our immediate region (Wake County), I do not believe we should behave as if the crisis is over.
It would be helpful to also track the death rate. There are so many factors involved in the case rate (test availability being one: you could not even get tested in Wake County in March unless you presented sufficient symptoms to require hospitalization because the tests were so hard to come by).
The death rate is particularly telling: 42 deaths since February (out of 1.1 million people) and I think it has been less than one person a week for the last few weeks. In addition, the age distribution for deaths is fairly well established: 80-95% of deaths are people 65 or older.
That information is also available from John Hopkins and they put it on github, so anyone can download it and run their own numbers; both confirmed and death data are provided for US by county. (https://github.com/CSSEGISandData/COVID-19)
Wake County population: 1.1 million (https://www.census.gov/quickfacts/wakecountynorthcarolina)
Wake County COVID-19 deaths: 42 (as of 6/18) from dashboard
Wake County deaths by age: n/a (NC deaths by age: https://covid19.ncdhhs.gov/dashboard#by-age)
Wake County dashboard: https://covid19.wakegov.com/
Thanks Greg. It’s obvious from the comments that people want more information. Thanks for sharing your sources.
Thanks, Greg, for that link – I had found that a month or so ago but couldn’t find it again. Hal, I think my point is that it doesn’t appear that the infection rate is rising. There are still infections, but it’s at the same rate based on NC data. Regardless, the Governor’s not asking for my opinion and it’s not open for discussion at this point. I just wanted to mention the exclusion of data on which to base that conclusion seems to be prevalent and would it be nice if…. Thank you.